- Director's Note
- Special Report on Student Financial Health Coming in February
- Are Your Data Worth the Weight?
- Pathways Toolkit: Intersecting Engagement Data With Guided Pathways
- Spotlight on Zane State College (OH)
- Center Holds Focus Groups That Spotlight Enrollment Status
- The Center Goes On the Road
Director's Note
January 2017
It’s finally here—the updated CCSSE instrument.
Since 2001, the Center has provided actionable student engagement data to two-year colleges across the United States and beyond, and since 2004 the CCSSE instrument had remained unchanged.
Informed by analysis of CCSSE data, member college feedback, and cognitive interviews with community college students, Center staff knew it was time to refresh the instrument. The survey update was not intended as an overhaul, rather a series of changes—edits to some items, removal of a few outdated items, and the addition of several High-Impact Practices items—to improve the quality of data available to colleges and make the survey more relevant in relation to changes in community colleges.
In addition, we are looking forward to the new way survey results will be released—including more user-friendly graphs. Again, by listening to our member colleges, we learned that many of our users had the desire to have graphical tools available for sharing the data with others. Therefore, in an attempt to help institutional researchers share results with a broader audience and facilitate moving data to information, the Center has created graphical elements that will be easy to cut and paste into presentations.
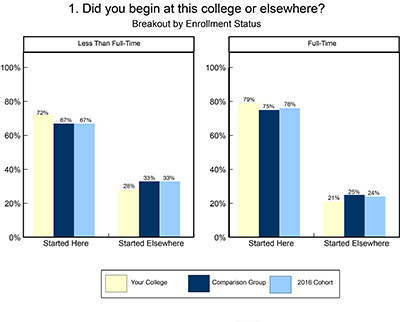
Example graphical element
It’s an exciting time, and we look forward to hearing from you about the new changes.
Stay in touch!

Special Report on Student Financial Health Coming in February
Forty-seven percent of Community College Survey of Student Engagement (CCSSE) respondents
say that a lack of finances could cause them to withdraw from college, and 39% of survey respondents
report receiving Pell Grant funds to help pay for college. Several states have programs in place
to respond to students' need for financial support, and many others have introduced legislation
with the same goal. While these scholarship and tuition waiver programs are helping many students
pay for college, the cost of tuition is not the sole financial need of many students.
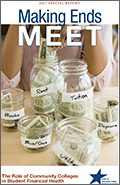
To learn more about community college student financial health, the Center partnered with several organizations to create a set of additional items that were added to the CCSSE 2016 survey administration. Next month, the Center will release a special report funded by the MetLife Foundation, Making Ends Meet: The Role of Community Colleges in Student Financial Health, highlighting the findings from that data collection. The report will explore student financial health, including students’ perceptions of their current financial circumstances, budgeting practices, and financial management skills.
Almost two-thirds of working students report living paycheck to paycheck, and over half of those who report paying bills say that it is a struggle to keep up from time to time. However, over three-quarters of students say that they have the skills to manage their own finances. These findings raise a number of questions that the report explores, and they also leave colleges with a strong charge: ensuring that students have access to available financial support resources and ensuring that students are equipped to manage their finances.
The report release will include a student financial health discussion guide to be used by members of the college community and a student focus group guide that can be used to capture student voices around issues of financial health.
Come engage with Center staff as we present on the report at the following spring conferences: AACC, DREAM, League Innovations, and SXSWedu.
Are Your Data Worth the Weight?

The Center's sampling methodology focuses on students, but it samples classes because in-class administration is an effective way to administer the survey while ensuring high response rates. However, this approach introduces a sampling bias. Because full-time students are enrolled in more classes than part-time students, the former have more opportunities to be sampled. To correct for this, the Center developed statistical weights.
Weights are uniquely calculated for each institution using the most recent publicly available IPEDS data. The weight variable, IWEIGHT, is found in each college's raw data set. Below are the formulas Center researchers use to calculate weights for part-time and full-time students.
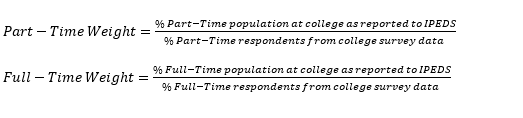
This formula uses the ENRLMENT variable (Item 2 on both the CCSSE and SENSE instruments) to determine the percentages of part-time and full-time students among colleges' survey respondents (the denominator in the formulas above). Students who do not answer this item will have a missing IWEIGHT value and will be excluded from all Center analyses.
The weighting scheme described above was developed for and is appropriate for analysis at the national level. However, an individual college’s student characteristics may not closely align with the national distribution of student characteristics. Therefore, the Center encourages member colleges to carefully compare the characteristics of survey respondents with those of the college's student population in order to evaluate the representativeness of survey respondents. This can be accomplished by referring to Appendix Table 1 on the Standard Reports page, which compares the distributions for "Your Respondents Percentage" (survey data) and "Your Population" (percentages from IPEDS), to determine if the distributions are reasonably similar. It is important to keep in mind that the most recent IPEDS data are two to three years old and may not accurately represent a college’s current student population. For example, if a college has experienced a significant change in enrollment characteristics during the two to three years prior to administering a survey, the college’s institutional research department may want to consider whether the weights included with the raw data file are suitable, or if new weights using current enrollment characteristics would be more appropriate.
The Custom Report Requests tool on the website offers the option to run analyses weighted or unweighted, with weighted being the default. Under certain circumstances, unweighted analyses may provide more interpretable results. Center researchers believe these circumstances are rare, but do occur: For example, if a college’s enrollment is 80% or more full-time students, very few part-time students may be among the survey respondents. In this case, analyzing unweighted data will likely provide more accurate estimates of student experiences.
The Center’s research team can be contacted at data@cccse.org.
Pathways Toolkit: Intersecting Engagement Data With Guided Pathways
The Pathways Project, funded by the Bill & Melinda Gates Foundation and led by the American Association of Community Colleges (AACC), aims to help community colleges design and implement structured academic and career pathways for all students. The Pathways Model is composed of essential institutional practices that help students along their journey to success. The Center is one of seven partners in this work and recently developed tools that include items from CCSSE and SENSE that are aligned with important dimensions of the Pathways Model.
As colleges begin to undertake serious work on the various necessary aspects of the design and implementation of structured student pathways, these tools can be used to facilitate important conversations about gaps and areas of alignment in three key areas: helping students get on a path, helping students stay on their path, and ensuring that students are learning.
Examples of Center survey items for each key area include the following:
Helping Students Get on a Path:
CCSSE Item 4m, "In your experiences at this college during the current school year, about how
often have you talked about career plans with an instructor or advisor?"
Helping Students Stay on Their Path:
SENSE Item 23, "Was a specific person assigned to you so you could see him/her each time you
needed information or assistance?"
Ensuring That Students Are Learning:
CCSSE Item 9a: "How much does this college emphasize encouraging you to spend significant
amounts of time studying?"
To read more about the Pathways Model and to view this toolkit, visit the Tools and Resources page for the Pathways Project.
Spotlight on Zane State College (OH)

Zane State College (OH) has frequently participated in Center surveys since 2004 and uses Center survey data in much of its continuous improvement work, including accreditation. Accredited through the Higher Learning Commission via the AQIP (Academic Quality Improvement Program) pathway, Zane State uses Center survey data to make comparisons to peer institutions (in the Achieving the Dream consortium as well as other Ohio institutions), with comparisons made at both the benchmark and individual item level, especially in the area of student support. The college also utilizes Center survey data throughout the AQIP Systems Portfolio, specifically in "Helping Students Learn," "Meeting Student and Other Key Stakeholder Needs," "Valuing Employees," and "Knowledge Management and Resource Stewardship."
For example, in utilizing Center survey data to support "Category One: Helping Students Learn," Zane State implemented two projects: "Building and Scaling Learner Analytics" and "Mandatory Advising." The "Building and Scaling Learner Analytics" project was developed as a pilot for an early intervention initiative and used specific SENSE items (19e, 20d[2], 20f[2], 20h[2] and 21a–c) and CCSSE items (4h, 4m, 9b–d, 9f, 13a[1], 13b[1], 13d[1], 13e[1], and 13h[1]) as the benchmarks against which to measure progress.
The "Mandatory Advising" project at Zane State initially used insights from CCSSE Promising Practices Item 16 ("Before the end of my first semester/quarter at this college, an advisor helped me develop an academic plan [a personalized plan with a defined sequence of courses for completing a college certificate or degree and/or for transferring to a 4-year college or university]") as the impetus for continuous improvement work. Combining survey results with data on retention and course evaluations, the college used the subsequent findings as a metric for defining success of the project in support of the AQIP accreditation category "Helping Students Learn."
In the 2011 accreditation review, peer reviewer feedback in the results section of "Helping Students Learn" recognized Zane State as having a strength for its use of CCSSE and SENSE data in assessing improvement efforts.
The college believes that Center survey data align particularly well with AQIP "Category One: Helping Students Learn" and plans to continue to include these data to demonstrate process improvement in its upcoming Systems Portfolio for re-accreditation.
The Center provides a comprehensive Accreditation Guide with college examples online.
Center Holds Focus Groups That Spotlight Enrollment Status

In April the Center will release a national report on enrollment status and student success in the community college. Even One Semester: Full-Time Enrollment and Student Success is based on analysis of CCSSE 2016 data as well as student transcript data from 28 colleges. In addition to the quantitative data the report will present, the Center conducted a series of focus groups with part-time students, full-time students, and faculty to provide a voice to the student experience and the factors that influence enrollment status.
When part-time participants were asked why they were attending college part-time, several themes emerged.
Difficulty of courses:
"I can say that, for myself, it has been a little bit easier being a part-time student because I don’t have so much of a load. I do still get overwhelmed very often, but at the same time, it’s easier for me to pick up and try to figure out how to better myself with that."
"As I started progressing, the courses kept getting harder and harder. Between financial and just the strain of the class itself, I think that both contributed to me weaning back what kind of course load I was taking."
Scheduling issues:
"I’m getting up to the higher level classes here and I work Friday through Sunday, so it’s hard to find a class that’s not on Fridays here."
Working:
"Full-time job. It’s really hard to have, even, six credits, which is the lowest you can have—seems like—it’s the lowest you can have and have financial aid. It’s even a struggle to have a 40- to 48-hour job and six credits."
"Mine’s money. If someone wants to pay my bills, that would be great."
Full-time participants also spoke of financial challenges:
"If it wasn’t because of financial aid, I wouldn’t be studying in the first place, so it’s challenging. Even when I’m a part-time worker, it’s not enough for me, and my parents are pretty poor, so that’s the thing about that. Sometimes I’ve struggled the most with the stress about the money and not just for my classes and the assignments that I have to do, so that’s kind of hard, I think, yeah."
Part-time and full-time participants spoke positively about the availability and support they received from their instructors, but they emphasized the desire for having just one advisor:
"Just try to keep up with students more, see how they’re doing, and one advisor would be nice. I know, in high school, that’s what I had, and there were times where I had to see a different advisor than my normal one, and they just did not understand."
"I think if you could have one advisor and not just shuffle to whoever has time. I think if they could take the time to spread out not just this semester, but, ‘Oh, you want your associate of science,’ or, ‘Oh, you think you want this. Let’s look at the next year and a half and see if this is feasible.’"
In addition to the incorporation of relevant quotes in Even One Semester, video clips of these focus groups will be added to the Center’s YouTube video library in April. The Center’s YouTube library contains a wealth of student and faculty voices on topics from academic goal-setting to developmental education.
The Center Goes On the Road
Look for our sessions at these upcoming events:
Achieving the Dream's DREAM
February 21 – 24, 2017
San Francisco, California
TAIR Annual Conference
February 26 – March 1, 2017
Houston, Texas
SXSWedu
March 6 – 9, 2017
Austin, Texas
League Innovations Conference
March 12 – 15, 2017
San Francisco, California
AACC
Annual Convention
April 22 – 25, 2017
New Orleans, Louisiana
Booth #134
Assessment, Teaching & Learning Conference
May 3 – 5, 2017
Spokane, Washington
AIR Forum
May 30 – June 2, 2017
Washington, DC
We can also come to you!
Colleges interested in Center staff conducting workshops, speaking engagements, or other professional-development events can direct inquiries to info@cccse.org.
Additionally, the Center offers free workshops to statewide systems in which all colleges join CCSSE or SENSE at the same time.